
How to measure an executive's LinkedIn: compare every post with your own median
By Indrek Põldvee, founder of B2B Growth
Indrek has taught people how to use LinkedIn for more than six years. In 2019 he founded B2B Growth, which has trained more than 4,000 people on LinkedIn, worked on more than 1,000 profiles and built 50+ LinkedIn strategies. Before that he co-founded Sorry as a Service, which went through Techstars London in 2017, and hosted the Estonian entrepreneurship podcast “Hakkame tegutsema” (100+ interviews, 350,000+ downloads). He has delivered trainings across the Baltics, Finland, Sweden, the Netherlands, the UK, Hungary and India. Indrek on LinkedIn
A managing director posts on LinkedIn. The post gets 180 reactions and comments. A week later a sales expert in the same company posts. That post gets 45.
Which post did better?
Most people say the first one. Most reports say the same. And most of the time it's the wrong answer.
The managing director has more followers, more connections and a bigger title. Their posts always get more. So 180 mostly tells you how big the account is. It tells you very little about whether this post was good.
There is a simpler and fairer way to measure LinkedIn performance on a personal profile. Compare every post with the same person's usual post. In this article we'll show how to do it, with one formula, a worked example and a short monthly routine.
Key takeaways
- Raw numbers measure the account, not the post. A big account always looks better than a small one.
- Compare each post with your own median. Score = this post's engagement ÷ the median of your last 20 posts.
- Use the median, not the average. One unusual post pulls the average up. The median stays where your normal post is.
- 1.0× is your normal. Above 1 is better than usual, below 1 is weaker than usual.
- Judge a post by its job. A post meant to build trust should be saved. A post meant to sell should get clicks. Not every post needs reactions.
- One post proves nothing. Look for patterns over several posts and over the month.
Contents
- Why raw numbers mislead
- The idea: compare every post with your own median
- Why the median and not the average
- How to calculate the score, step by step
- How to read the score
- Judge each post by the job it had
- What the score can't tell you
- Look at the month, not only the post
- Company pages need a different yardstick
- A 15-minute monthly routine
- Frequently asked questions
1. Why raw numbers mislead
LinkedIn's analytics for a personal profile show you numbers for every post: impressions, reactions, comments, reposts and more. These numbers are real. The problem is what we compare them with.
When you put two people side by side, the bigger account wins almost every time. When you put one person's posts from this year next to last year, the account has grown, so the posts look better even if the writing hasn't changed. When you compare yourself with someone you admire in your industry, you're mostly comparing follower counts.
The data shows how big the size effect is. In the Scripe Labs LinkedIn Trend Report 2026, a study of 3.26 million LinkedIn posts, a typical post reached about 8–10% of followers on accounts with more than 10,000 followers, and about 20–30% on accounts with fewer than 2,000. The study covers personal profiles in English and German, and its figures show associations, not causes.
So size changes not only how many people see a post, but also what share of your followers does. Raw numbers carry all of that with them.
There is a second problem. Raw numbers make people chase the wrong thing. A leader sees that a colleague's post got 300 reactions and theirs got 60. They conclude that they are doing something wrong. Often they aren't. Their 60 may be twice as good as their own usual result.
2. The idea: compare every post with your own median
The fix is simple. Stop comparing a post with other people. Compare it with the same person's usual post.
This is how the Scripe Labs report measured every post in its data set. For each post it took the median engagement of the same author's last 20 posts (or fewer, if the author had fewer). Then it divided the post's engagement by that median. Engagement there means reactions, comments and reposts added together.
The result is one number per post. We call it the score.
Score = engagement on this post ÷ median engagement of your last 20 posts
A score of 1.0× means the post did exactly as well as your usual post. 1.5× means 50% better than usual. 0.7× means 30% weaker than usual.
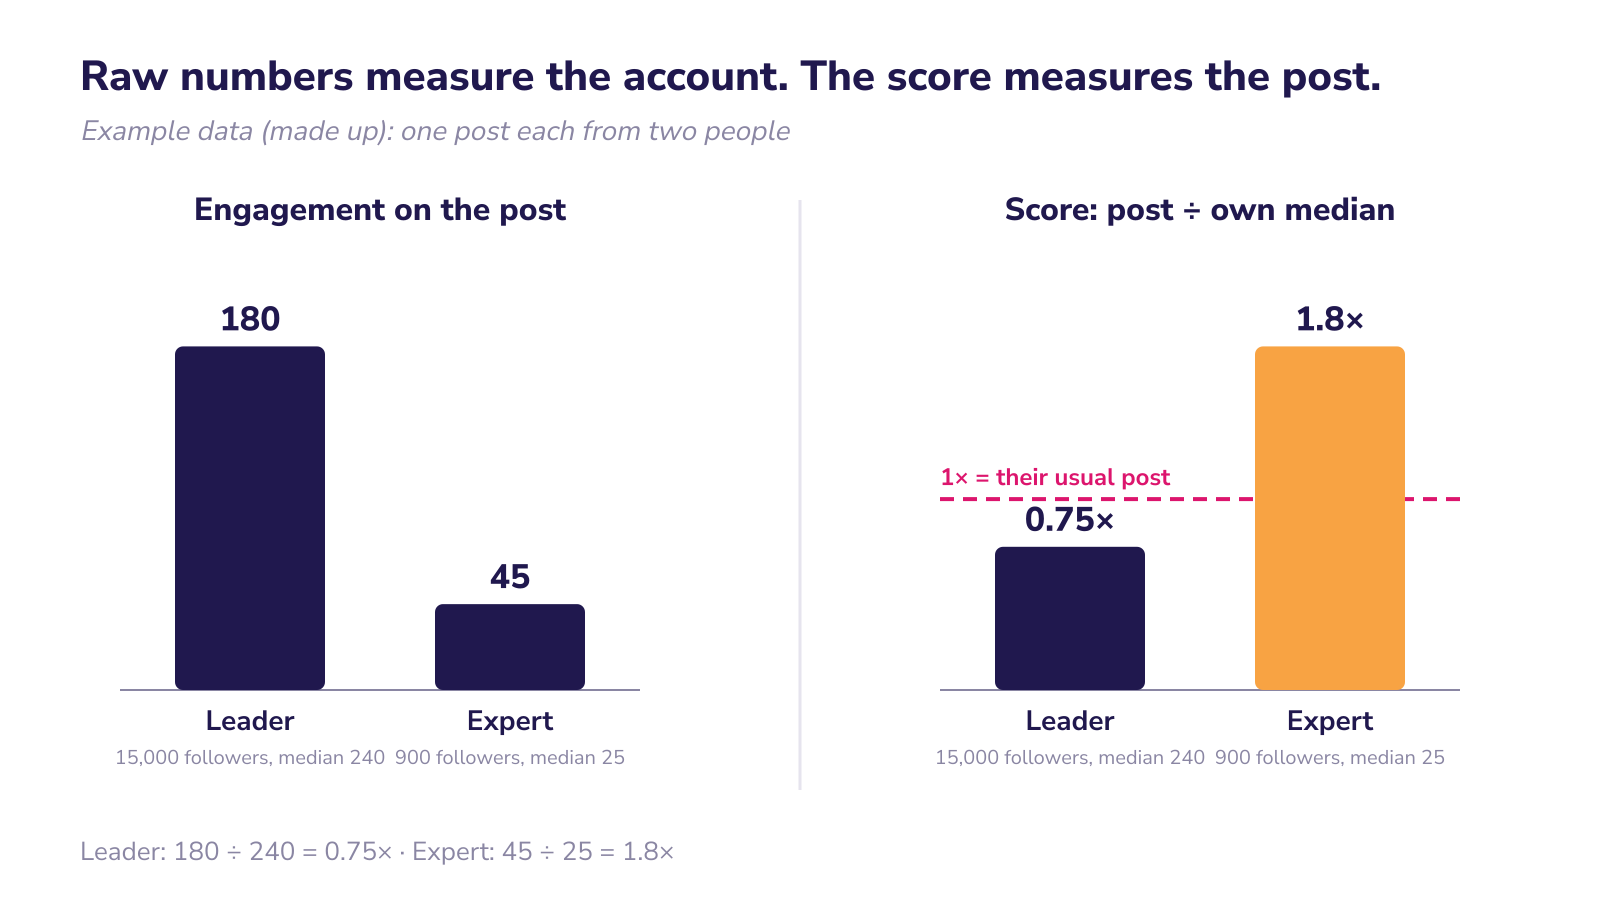
Now look at the two posts from the start again, with made-up numbers. The managing director's usual post gets 240. This post got 180. Score: 180 ÷ 240 = 0.75×. The sales expert's usual post gets 25. This post got 45. Score: 45 ÷ 25 = 1.8×.
The raw numbers said the managing director won. The score says the expert wrote the stronger post, by a wide margin.
This matters for a leader. It means you aren't competing with anyone else's follower count. You're competing with your own normal. That's a fair game, and one you can actually win.
3. Why the median and not the average
The average sounds more familiar, so why not use it?
Because one unusual post breaks it. Take five made-up posts with 40, 45, 50, 55 and 400 engagements. The average is 118. The median, the middle value when you sort them, is 50.
Which number describes your usual post? Clearly 50. Four of the five posts were close to it. The average of 118 describes none of them. If you used it as your yardstick, every normal post would look like a failure for months after one lucky post.
The median ignores the extremes on both sides. A post that took off doesn't pull it up much. A post published on a bad day doesn't drag it down much. It stays where your normal post is.
There's a practical reason too. Nobody can predict which post will take off. In our experience, every topic can work if it is well written and aimed at the right people. But going viral can't be planned. Even the time and day don't decide it: one post goes, the next one at the same time doesn't. A yardstick that jumps every time a post goes viral isn't a yardstick.
4. How to calculate the score, step by step
You don't need a tool for this. A spreadsheet is enough.
Step 1. Collect the numbers. For each post, write down the date, reactions, comments and reposts. You find them in the post's analytics on LinkedIn. You can type them in by hand or export them, if your account offers an export.
Step 2. Wait before you record. Don't measure a post on the day it was published. In the Scripe data, 53% of comments came within 6 hours, but 90% only within 3 days. Record a post's numbers once it is at least three days old, and do it the same way every time.
Step 3. Add up engagement. Engagement = reactions + comments + reposts.
Step 4. Divide by the median of the 20 posts before it.
Here's how it looks in Google Sheets or Excel. Put one post per row, oldest at the top. Column A is the date, B reactions, C comments, D reposts.
- In E2, engagement:
=B2+C2+D2and copy it down. - In F22, the score for the 21st post:
=E22/MEDIAN(E2:E21)and copy it down.
Because the range is relative, each row automatically looks at the 20 posts right before it. The window rolls forward on its own.
If you have fewer than 20 posts, use the ones you have. For example, to score the 11th post against the 10 before it: =E12/MEDIAN(E2:E11). With fewer than about ten earlier posts the median moves a lot, so treat the score as a rough signal.
If you prefer to see it as a percentage, format column F as a percentage or use =E22/MEDIAN(E2:E21)-1. Then +50% means 1.5×.
A worked example (made-up numbers)
Imagine one person's last 12 posts had these engagement totals: 38, 52, 41, 120, 45, 30, 47, 60, 22, 44, 49 and 95.
Sorted, they are 22, 30, 38, 41, 44, 45, 47, 49, 52, 60, 95, 120. With an even number of posts, the median is the middle of the two central values: (45 + 47) ÷ 2 = 46.
Now the scores are easy to read:
- The post with 120 scored 120 ÷ 46 = 2.6×. Something about it worked.
- The post with 95 scored about 2.1×.
- The post with 22 scored 22 ÷ 46 = 0.48×. It was about half of this person's normal.
- Most other posts sit between 0.7× and 1.3×. That's normal variation.
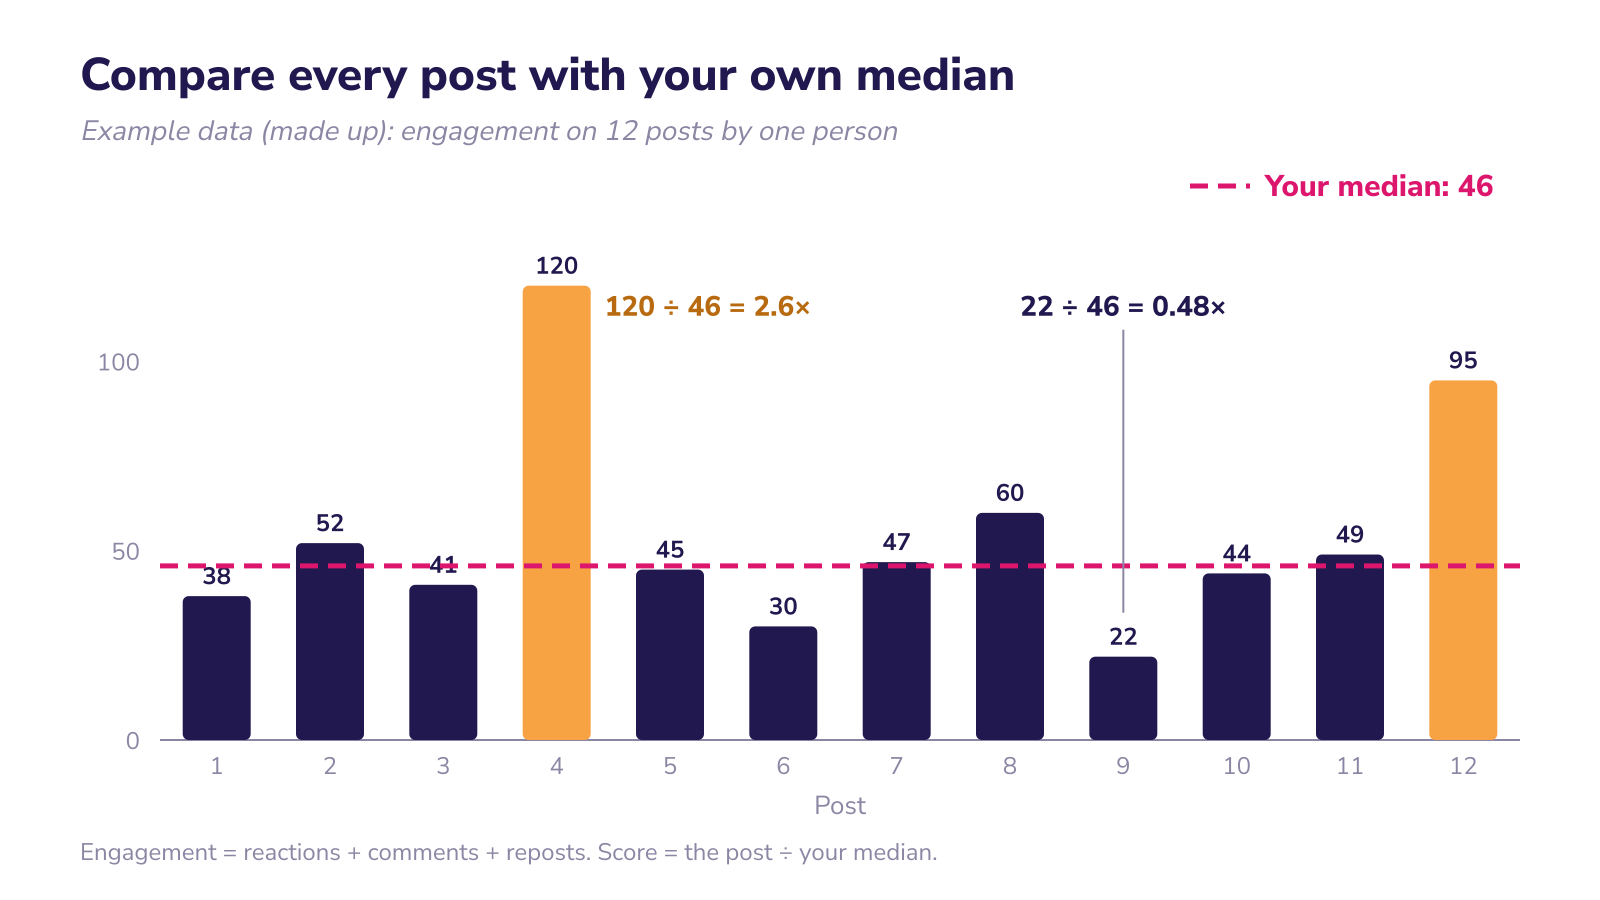
For simplicity, the chart uses one median for all 12 posts. In the spreadsheet each post is compared with the posts before it, so the numbers will differ a little. The idea is the same.
5. How to read the score
The score is a filter, not a verdict. It tells you which posts are worth a second look.
A simple way to read it:
- Well above 1× (for example, 1.5× or more): look at what was different. The topic? The first line? A real photo? An event, like a new role or a project milestone?
- Around 1×: a normal post. Most posts land here. That's fine.
- Well below 1× (for example, 0.6× or less): look at what was different, without panic. A link in the post? A topic outside your usual area? A holiday week?
The thresholds above are our suggestion for where to start looking, not a rule.
The most useful question isn't "was this post good?" It's "what did the posts that scored highest have in common?" After two or three months you usually see a pattern. Maybe stories from customer meetings score higher than opinions on the industry. Maybe posts with a real photo do better than posts with a designed graphic. Those patterns are what you take into the next content plan. Who those topics should speak to is covered in our article on the ideal LinkedIn audience.
The large studies give you hints about what to look for. In the Scripe data, posts about something that actually happened, such as a new role, beat the author's usual post more often than advice posts did. But your own scores tell you what works for your audience, which is what really matters.
6. Judge each post by the job it had
There's one trap in any engagement score. It treats every post as if its only job were to get reactions. That isn't true.
Some posts are meant to reach new people. Some are meant to build trust with people who already follow you. Some are meant to get someone to click, register or get in touch. Each of these leaves a different trace.
The Scripe report shows this clearly for personal profiles. Posts aimed at trust, such as guides and frameworks, earned slightly less engagement than the author's usual post (0.97×) but 1.41× more saves. Posts aimed at conversion reached fewer people (0.79×) but brought about 3.8 times more link clicks per post. The report's advice is to judge each stage by what it brings.
The same logic applies to single signals. In the Scripe data, long, structured posts tend to be saved. Long posts and video tend to be sent to others in private messages. Posts that open with "I" tend to bring more profile visits.
In practice:
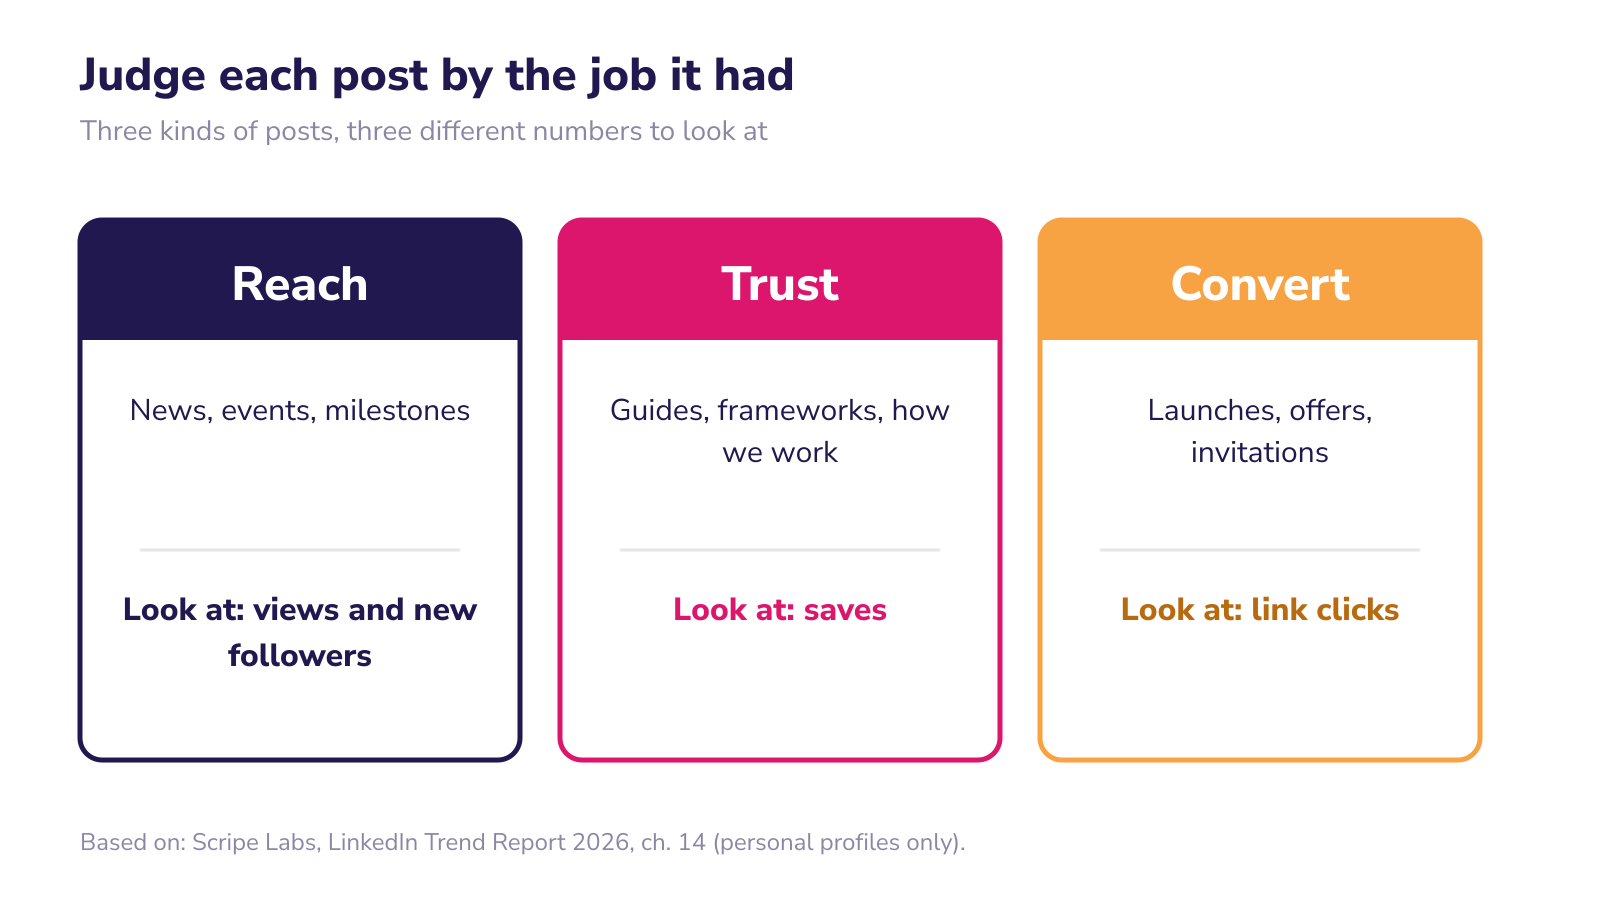
- Reach posts (news, events, milestones): look at views and new followers.
- Trust posts (how we work, guides, lessons): look at saves and sends.
- Convert posts (an offer, an event invitation, a launch): look at link clicks and messages.
You can use the same median method for any of these. Score a trust post by its saves against your median saves. Score a convert post by its clicks against your median clicks. Then a practical guide with average reactions but twice your usual saves isn't a weak post. It did its job.
The simplest way to make this work is to decide the job before the post is published. Add one column to your sheet: Reach, Trust or Convert. It takes five seconds and saves a lot of wrong conclusions later.
7. What the score can't tell you
The score is useful because it's simple. That also means it has limits. Be honest about them.
One post proves nothing. A single high score can be luck: a colleague shared it, the right person commented early, the topic was in the news that day. A single low score can be bad timing. Draw conclusions from patterns across several posts, not from one.
It shows connection, not cause. If posts with photos score higher, it doesn't prove the photo caused it. Maybe you only take photos when something interesting happens. The Scripe report makes the same point about its own data: authors tell stories when they have a story.
It doesn't measure business results. A score says how a post did compared with your normal. It doesn't say whether the post brought a customer, a candidate or a partner. For that you need other signals: who wrote to you, who mentioned your post in a meeting, which profiles visited yours.
Your median changes over time. That's the point. If you get better, your median rises and the bar rises with it. A score of 1.0× this year may be more engagement than 1.3× was a year ago. If your score falls, check the median before you call it a decline: the bar may simply have risen.
It's built for personal profiles. The Scripe data covers personal profiles only, in English and German. Company pages work differently. We come back to that below.
8. Look at the month, not only the post
There's one more trap. When someone starts posting more often, the numbers per post often go down. People see that and think something is broken.
It usually isn't. In the Scripe data, doubling the number of posts cost about 11% of views per post, but the total for the month grew. For smaller accounts, posting more often also brought more new followers.
So look at two levels:
- Per post: the score against your median. Which posts worked and why.
- Per month: total views, total engagement, new followers, and the signals that matter for your goal, such as profile visits or messages.
If scores per post dip a little while the month as a whole grows, that's usually a good month.
9. Company pages need a different yardstick
Everything above is about personal profiles. For a company page we use a different measure: engagement per 1,000 followers.
The logic is the same. Raw numbers favour big pages, so you divide by size. For company pages the size is the number of followers, and we always take it at the start of the period, so that growth during the period doesn't distort the result.
How to calculate it is covered in our article on engagement per 1,000 followers. You can see one example in our BENU case study. What matters here: don't mix the two. We explain the difference in our article on company page vs personal profile. A leader's profile is measured against itself. A company page is measured against its size and, if you want, against similar pages.
10. A 15-minute monthly routine
If you want to start this month, here's the shortest version:
- Open your sheet. One row per post, with date, job (Reach, Trust or Convert), reactions, comments and reposts.
- Add last month's posts. Only posts that are at least three days old.
- Let the formulas run. Engagement in column E, score in column F.
- Mark the top two and the bottom two scores. Write one line next to each: what was different?
- Check trust and convert posts separately. Saves for trust, clicks for convert.
- Look at the month total. Views, engagement, new followers.
- Write down one decision. For example: "More posts from customer meetings, with a real photo." Just one.
Do this for three months before you change anything big. One month is too little. Three months shows a pattern.
Frequently asked questions
How do I measure LinkedIn performance on a personal profile? Compare each post with your own usual post. Add up reactions, comments and reposts, then divide by the median of your last 20 posts. Above 1× is better than usual, below 1× is weaker.
Why not just look at impressions? Impressions mostly reflect how big your network is. They are useful for the month as a whole. For judging a single post, the score against your own median is fairer.
How many posts do I need before the score makes sense? Twenty is ideal. You can start with fewer, but with fewer than about ten earlier posts one unusual post moves the median a lot. Treat early scores as a rough signal.
When should I record a post's numbers? After at least three days. Most comments come in the first hours, but in the Scripe data about 90% arrive within three days.
My post went viral. Should I try to repeat it? Look at what was different, but don't build a plan on one post. Virality can't be predicted. Repeat the patterns that show up across several high-scoring posts.
Does this work for company pages? Not in the same way. For company pages we use engagement per 1,000 followers, with followers counted at the start of the period.
If you want help with an executive profile, see our executive profiles service.
Want to know where your company page or your leaders' profiles stand today? We run a free LinkedIn audit for B2B companies across Europe. You choose what we look at: a leader's personal profile or your company page. We'll tell you what works and what holds you back. Book a free audit
Want us to look at your LinkedIn?
The LinkedIn audit is free, for your company page or a leader's profile, and you speak directly to Indrek.
Get a free audit